Abstract
Employees with frequent business travel experience time lost with family and productive work time while in transit. In order to minimize lost time, 2017 flight history departing from Tucson International Airport (TUS) was used to build a model to predict which routes experience the least disruptions. Multiple model types were investigated using input parameters that a customer would know prior to purchasing a flight (airline, flight number, destination, scheduled departure time, scheduled arrival time, day of the week and flight distance). The models predicted if an individual flight might be canceled, diverted or delayed for more than 30 minutes. The most successful model was a random forest classifier model. However, the model scores did not meet the minimum accuracy and precision requirements of 70%. It is believed that there are enough random chance occurances and airline schedule modifications influencing the data to make accurate prediction impossible.
Model Input/Output Feature Assessment
Models were built from the data contained in 2017.csv. There were a large number of columns that needed to be assessed as to their suitability for including in the model. The following describes the available source data columns and how each were dispositioned for modeling input, output or ignored.
Input values to the model (known by customer)
- OP_CARRIER: airline designation code
- OP_CARRIER_FL_NUM: flight number
- day_of_week: flight day of the week calculated from FL_DATE
- DEST: destination airport code
- CRS_DEP_TIME: scheduled departure time
- CRS_ARR_TIME: scheduled arrival time
- DISTANCE: flight distance
Output values used to train the model (of interest to the customer)
- CANCELLED: flight canceled [0 = No, 1 = Yes]
- DIVERTED: flight diverted [0 = No, 1 = Yes]
- DELAY: flight ARR_DELAY greater than 30 minutes [0 = No, 1 = Yes]
Input values not included in the model (note, any numerically possible calculations are indicated)
- Irrelevant or duplicate information
- ORIGIN: departure city, filtered for TUS departures only
- FL_DATE: flight date
- CRS_ELAPSED_TIME: scheduled elapsed time (minutes)
- Information not known prior to departure
- DEP_TIME: actual departure time, CRS_DEP_TIME + DEP_DELAY
- WHEELS_OFF: actual wheels off time, DEP_TIME + TAXI_OUT
- WHEELS_ON: actual wheels on time, ARR_TIME - TAXI_IN
- ARR_TIME: actual arrival time, DEP_TIME + ACTUAL_ELAPSED_TIME + time zone difference, CRS_ARR_TIME + ARR_DELAY
- TAXI_OUT: calculated time spent in taxi between departure time and wheels off (minutes)
- TAXI_IN: calculated time spent in taxi between wheels on and arrival time
- AIR_TIME: calculated time spent in the air (minutes)
- ACTUAL_ELAPSED_TIME: time between gates, TAXI_OUT + TAXI_IN + AIR_TIME (minutes)
- Information that directly reveals the output values the model is predicting
- DEP_DELAY: departure delay time (minutes)
- ARR_DELAY: actual arrival time delay (minutes), CARRIER_DELAY + WEATHER_DELAY + NAS_DELAY + SECURITY_DELAY + LATE_AIRCRAFT_DELAY
- CANCELLATION_CODE: reason for cancellation
- CARRIER_DELAY: arrival delay time due to carrier (minutes)
- WEATHER_DELAY: arrival delay time due to weather (minutes)
- NAS_DELAY: arrival delay time due to NAS (minutes)
- SECURITY_DELAY: arrival delay time due to security (minutes)
- LATE_AIRCRAFT_DELAY: arrival delay time due to aircraft (minutes)
Data Preparation
The 2017.csv data was prepared for modeling in the following manner.
- Initialized consistent random seed
- Collected model input and output values into X and y arrays.
- Converted categorical columns into one-hot-encoding columns.
- Split the X and y data into training (X_train & y_train, 70% of data) and testing (X_test & y_test, 30% of data) groups.
- Applied MinMaxScaler transformation to X_train and X_test.
- Saved X_train, y_train, X_test and y_test to csv files to ensure that all models used the same input and output data.
Model Investigation
Each model was built and scored from the same source data. Scoring was reviewed for Canceled, Diverted and Delayed model outputs. None of the models showed any capability for predicting canceled or diverted flights. Model details are presented in the order of best to worst model precision:
- Random Forest Classifier (no hyperparameter tuning done in the initial investigation)
- Decision Tree Classifier (no hyperparameter tuning done in the initial investigation)
- Logistic Regression (hyperparameter tuning completed in initial investigation)
- Neural Network (hyperparameter tuning completed in initial investigation)
- Support Vector Classification (computer resources were insufficient to produce this model)
| Description | Value |
|---|---|
| Overall Accuracy | 0.87 |
| Precision of Not Delayed Outcome | 0.89 |
| Precision of Delayed Outcome | 0.31 |
| ----- | ----- |
| Truth - # of flights without delays | 4087 |
| Predicted - # of flights without delays | 4434 |
| Truth - # of flights with delays | 535 |
| Predicted - # of flights with delays | 188 |
| Description | Value |
|---|---|
| Overall Accuracy | 0.87 |
| Precision of Not Delayed Outcome | 0.89 |
| Precision of Delayed Outcome | 0.30 |
| ----- | ----- |
| Truth - # of flights without delays | 4087 |
| Predicted - # of flights without delays | 4448 |
| Truth - # of flights with delays | 535 |
| Predicted - # of flights with delays | 174 |
| Description | Value |
|---|---|
| Overall Accuracy | 0.88 |
| Precision of Not Delayed Outcome | 0.88 |
| Precision of Delayed Outcome | 0.25 |
| ----- | ----- |
| Truth - # of flights without delays | 4087 |
| Predicted - # of flights without delays | 4618 |
| Truth - # of flights with delays | 535 |
| Predicted - # of flights with delays | 4 |
| Description | Value |
|---|---|
| Overall Accuracy | 0.12 |
| Precision of Not Delayed Outcome | 0 |
| Precision of Delayed Outcome | 0.12 |
| ----- | ----- |
| Truth - # of flights without delays | 4087 |
| Predicted - # of flights without delays | 0 |
| Truth - # of flights with delays | 535 |
| Predicted - # of flights with delays | 4622 |
Ideally a predictive model of flight cancellations, diversions, and delays would provide at least 70% accuracy and 70% precision. Several of the investigated models met the accuracy requirement, but none of them met the precision requirement. The accuracy requirement was met because the data set was heavily skewed with flights that were not canceled, diverted or delayed. As result models that biased the results toward no disruptions would have a reasonable accuracy score. Evidence for this can be seen in the overall accuracy and precision of not delayed outcomes matching within a few percentage points for all but the neural network model. More interesting were the precision scores for predicting delayed outcomes. Precision is a measure of how well the model reproduces each possible outcome. For the intended purpose of the model the precision of predicting cancellations, diversions and delays is the best indicator of model suitability. None of the models exceeded 70% precision on predicting flight disruptions and should be discarded.
Final Model Definition
In the interest of educating ourselves further in building/using predictive models, the random forest classifier model was further developed. Model preparation was completed as before, but hyperparameter tuning was added to further refine the model.
              # Hyperparamter tuning
              model = RandomForestClassifier(n_jobs=-1)
              param_grid = {
                  'n_estimators': [100, 1000, 5000],
                  'max_features': ['sqrt', 'log2']
              }
              grid = GridSearchCV(estimator=model, param_grid=param_grid, scoring='accuracy')
              grid.fit(X_train, y_train)
              grid.best_params_
              # Result: {'max_features': 'sqrt', 'n_estimators': 5000}

              # Build final model
              best_model = RandomForestClassifier(n_estimators=5000, max_features= 'sqrt', n_jobs=-1)
              best_model.fit(X_train, y_train)
The results of building the final model with 2017 training data and testing with 2017 test data were:
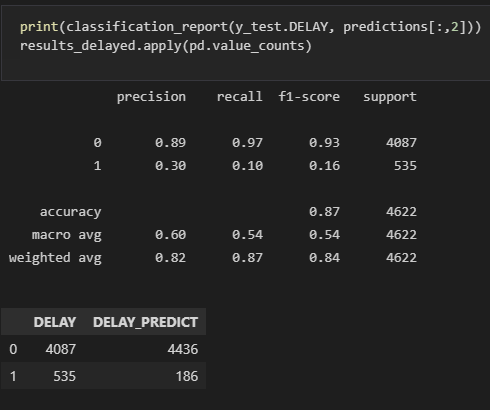
2017 Test Data Modeling
The following dashboard shows how well the model predicted the 2017 test data. There is very little overlap between real and predicted results indicating that the model was insufficient.
Go to Tableau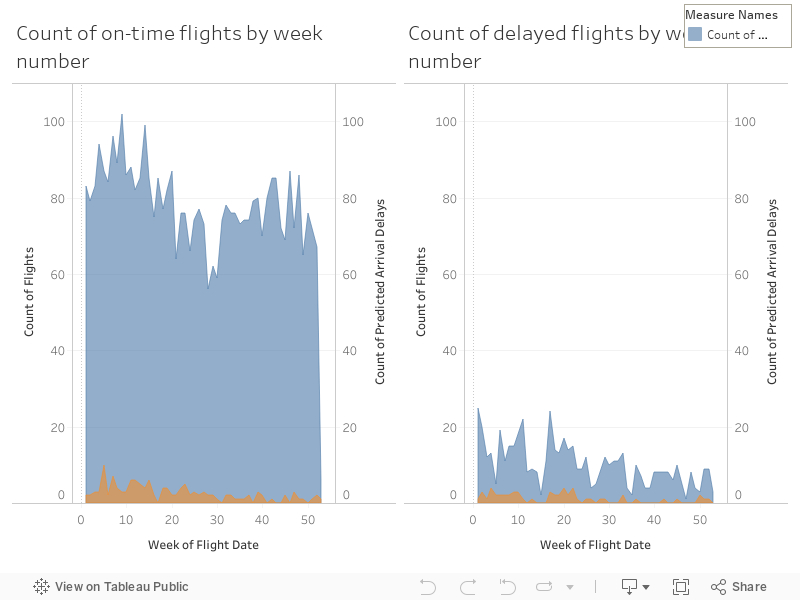
Predicting 2018 Flight Disruptions
Despite the low precision of the model, the team wanted to explore what would happen if the model was applied to 2018 flight data. Several issues arose immediately upon applying model's one-hot-encoding transformation to the new data set. 3 new airlines and 3 new destinations were added to the Tucson International airport schedule. The model could not be applied to any data associated with the new features (2823 of 18223 flights for the year). In order to move forward the 2018 was split into two arrays: data that could be applied to the model and data that could not. The data that could be applied to the model was then used to generate model predictions. The results of the predictions were:
| Description | Value |
|---|---|
| Overall Accuracy | 0.91 |
| Precision of Not Delayed Outcome | 0.91 |
| Precision of Delayed Outcome | 0 |
| ----- | ----- |
| Truth - # of flights without delays | 13982 |
| Predicted - # of flights without delays | 15400 |
| Truth - # of flights with delays | 1418 |
| Predicted - # of flights with delays | 0 |
The precision of 2018 predicted delays was 0 using this model. At first, the results were questioned and a code inspection was run to identify any errors. None were found. Reflecting upon what the results meant, we realized that the addition of 2823 flights to the schedule would have severely impacted the flight schedules of the other 15400 departing flights. As a result, any models created with data prior to the addition of new airlines and destinations would nullify their predictive results event if those predictions were any good in the first place. In addition to the new flights, the TUS airport remodeled both terminals, including remapping of airline gates between June 2016 and November 2017. This would have also impacted the ability of the model to create valid predictions.
Summary
Early on in the project the decision was made to analyze Tucson International Airport flights because of the airport's small size and small number of flights compared to other airports. This was done because transferring large data files and building models from large data sets takes a significant amount of time and computing resources. The discovery that the TUS airport experienced significant changes in 2017 and 2018 did not occur until the modeling was complete. However, the team recognized that the poor precision scores produced by the model were indicative of something important and further investigation provided a reasonable explanation. The TUS airport simply had too many changes over the time frame to reliably construct a predictive model. It is unknown, how well this modeling approach would succeed on data from another airport that did not undergo such drastic changes. That would be interesting to investigate further.
Source Data
The full data set available on Kaggle provides flight performance data for each year between 2009 and 2018.
- 2017.csv: Data set for model training and testing
- 2018.csv: Data to be predicted